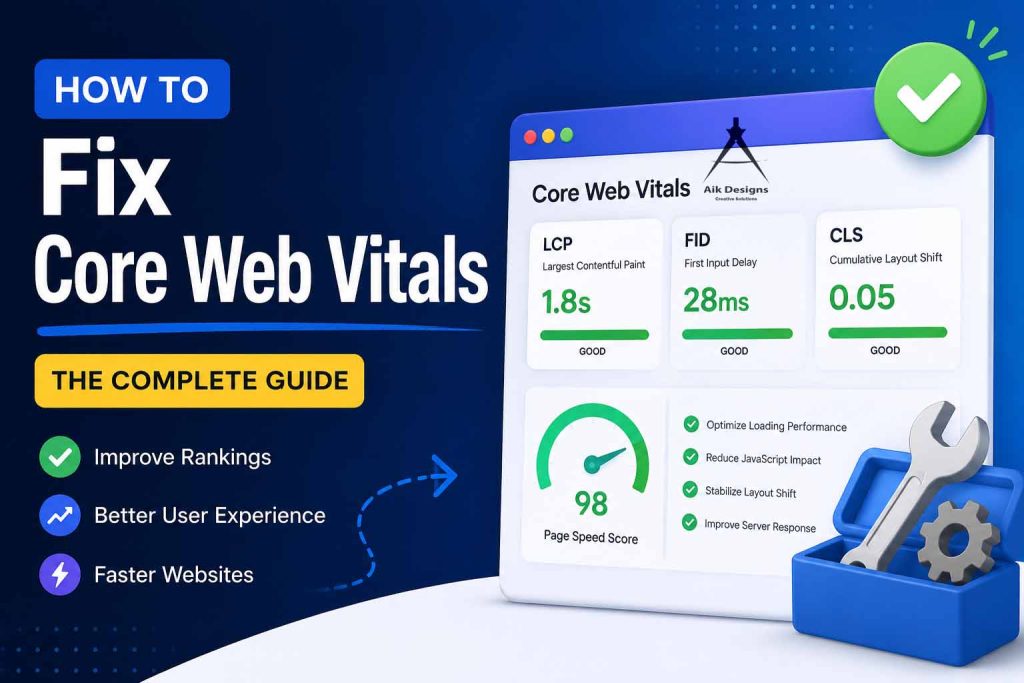
How To Fix Core Web Vitals: The Complete Guide

Google replaced First Input Delay (FID) with Interaction to Next Paint (INP) as a Core Web Vital in March 2024. INP is a much stricter measure — it captures the worst interaction delay across the entire page session, not just the first click.
Part 01 — LCPFixing Largest Contentful Paint
LCP measures how long it takes for the largest visible element on your page to fully render — typically a hero image, a large heading, or a featured video. It’s the metric most users feel as “that feeling when the page actually loaded.”
A good LCP score is under 2.5 seconds. Over 4 seconds is considered poor. Most websites fail LCP because of slow server response, render-blocking resources, and unoptimized images.
1.1 — Optimize and Compress Images
Images are responsible for LCP failures on the vast majority of websites. If your hero image is a 3MB JPEG, your LCP will never be fast regardless of what else you optimize.
-
Convert all hero and above-the-fold images to WebP or AVIF format. WebP is typically 25–35% smaller than JPEG at the same quality.
-
Set explicit width and height attributes on every image to reserve layout space and eliminate CLS simultaneously.
-
Add
fetchpriority="high"on your LCP image to tell the browser to prioritize it. -
Use
loading="lazy"on all images below the fold — but never on your LCP image. -
Use responsive images with srcset to serve appropriately sized images to each device.
1.2 — Preload the LCP Resource
If your LCP element is an image loaded via CSS background-image or a font that renders text, the browser won’t discover it until it parses the stylesheet. Use a preload hint to front-load discovery.
1.3 — Eliminate Render-Blocking Resources
Every render-blocking CSS file and synchronous JavaScript in your <head> delays LCP. The browser cannot paint anything until these files are downloaded and parsed.
-
Add
deferto all non-critical scripts. Addasyncfor independent third-party scripts like analytics. -
Inline critical CSS (the styles needed for above-the-fold content) directly in the
<head>and load the rest asynchronously. -
Split your CSS into critical and non-critical bundles using tools like PurgeCSS or Critical.
1.4 — Improve Server Response Time (TTFB)
A slow Time to First Byte (TTFB) sets a ceiling on how fast LCP can ever be. Even a perfectly optimized front-end can’t compensate for a server that takes 2 seconds to respond.
-
Use a CDN (Cloudflare, Fastly, AWS CloudFront) to serve content from edge nodes closer to your users.
-
Enable server-side caching for pages that don’t need to be dynamically generated per request.
-
Optimize database queries and add query caching to reduce database load.
-
Enable HTTP/2 or HTTP/3 on your server if not already active.
Many developers obsess over JavaScript bundle size while neglecting TTFB. If your server takes 1.8 seconds to respond, your LCP can never be under 2.5 seconds — no matter how fast your front-end is.
Part 02 — INPFixing Interaction to Next Paint
INP replaced FID as a Core Web Vital in March 2024 because it’s a far more accurate measure of responsiveness. While FID only measured the delay before a browser could start processing an event, INP measures the full delay from when a user interacts (click, tap, keyboard input) to when the next visual update is painted on screen.
A good INP is under 200ms. Over 500ms is considered poor. Most INP problems come from heavy JavaScript execution on the main thread.
2.1 — Reduce Long Tasks on the Main Thread
The browser’s main thread handles both JavaScript execution and rendering. When a long task (over 50ms) runs, all user input is blocked until it finishes — which is exactly what INP measures as “delay.”
-
Use Chrome DevTools Performance tab to identify and record long tasks. Look for red triangles in the flame chart.
-
Break long synchronous operations into smaller chunks using
setTimeout,requestIdleCallback, or the Scheduler API. -
Move heavy computation to Web Workers so it runs off the main thread entirely.
2.2 — Minimize JavaScript Bundle Size
The more JavaScript your browser has to parse, compile, and execute, the more it competes with user interactions for main thread time. Every kilobyte of JavaScript has a hidden cost beyond just download time.
-
Audit your bundle with Webpack Bundle Analyzer or Vite’s rollup-plugin-visualizer. You’ll likely find duplicate libraries and unused code.
-
Implement code splitting so only the JavaScript needed for the current page is loaded.
-
Use dynamic imports (
import()) for components that are below the fold or conditionally shown. -
Replace heavy libraries with lighter alternatives. Moment.js (67KB) → date-fns (tree-shakeable). Lodash → native ES methods.
-
Enable tree-shaking in your bundler to eliminate dead code automatically.
2.3 — Optimize Event Handlers
Poorly written event handlers are a major source of INP issues. Every click or keypress that triggers heavy synchronous work will show up as a bad INP score.
-
Debounce high-frequency event handlers like scroll, resize, and input to avoid hammering the main thread.
-
Avoid triggering forced reflows inside click handlers. Reading layout properties (offsetWidth, getBoundingClientRect) after a DOM write triggers a synchronous reflow.
-
Use event delegation — attach a single listener to a parent element rather than individual listeners on each child.
Part 03 — CLSFixing Cumulative Layout Shift
CLS measures the total amount of unexpected visual movement that happens during a page’s lifetime. Every time content jumps — because an image loaded without reserved space, an ad appeared, or a font swapped — the CLS score increases. It’s the metric most directly tied to user frustration: you’ve almost certainly clicked the wrong button because content shifted at the last second.
A good CLS score is under 0.1. Over 0.25 is considered poor.
3.1 — Always Define Image Dimensions
The most common cause of high CLS is images without explicit dimensions. Without width and height set, the browser has no idea how much space to reserve until the image is downloaded, so everything below it shifts down when it finally loads.
3.2 — Reserve Space for Ads and Embeds
Ads, iframes, and embedded widgets are notorious CLS culprits because their dimensions are often unknown until they load. Always pre-allocate the space they’ll occupy.
-
Give every ad slot a minimum height matching the expected ad size so space is reserved before the ad loads.
-
For embedded iframes (YouTube, Vimeo, Twitter), use the
aspect-ratioCSS property to reserve the correct proportional space. -
Use skeleton screens or placeholder elements that match the dimensions of the content that will replace them.
3.3 — Control Web Font Loading
Font swap causes two types of layout shift: the invisible-to-visible swap (FOIT) and the fallback-to-webfont swap (FOUT). The latter causes CLS when the two fonts have different metrics.
-
Use
font-display: optional— it only uses the web font if it loads within a very short window, eliminating FOUT entirely at the cost of potentially using the fallback font. -
Use the
size-adjust,ascent-override, anddescent-overrideCSS descriptors to match your fallback font’s metrics to your web font, minimizing visible shift on swap. -
Self-host critical fonts to eliminate an external DNS lookup and make them preloadable.
3.4 — Avoid Dynamically Injected Content
Banners, cookie notices, newsletter popups, and chat widgets that appear after the page loads push other content down, creating massive layout shifts.
-
Design cookie consent banners as overlays (fixed or sticky position) rather than in-flow elements. Fixed elements don’t cause CLS.
-
Pre-allocate space for dynamic banners with a reserved container that has the same height as the eventual content.
-
Animate new content into view using
transformandopacityonly — these are composited and don’t cause layout recalculation.
Also Read: How To Write For E-E-A-T
Tools to Measure & Monitor
Fixing Core Web Vitals starts with accurate measurement. Lab data (simulated) and field data (real users) often tell different stories. Use both.
Lighthouse runs in a controlled lab environment with throttled CPU and network. Your actual users on different devices and connections will have different scores. Always validate your Lighthouse improvements against Google Search Console field data — that’s what Google uses for rankings.
Start With What Hurts Most
Don’t try to fix everything at once. Open Google Search Console, identify your pages with “Poor” scores, and use PageSpeed Insights to find the specific issues. Most sites see the biggest gains from image optimization and eliminating render-blocking resources — start there.
Core Web Vitals are a continuous practice, not a one-time fix. Monitor your field data monthly.