Understand Website Performance Report in Google Search Console
All About Google Search Console Performance Report Help, New Google Search Console Updates 2020 & Support
Example Of Performance Report. Have You Ever Wandered Into A Google Search Console To Check Your Website Performance?
You may have checked
Google analytics to see how many visitors are roaming on your blog. No doubt, Google Analytics is a wonderful tool to show you real-time traffic and goals conversion, but Google Search Console displays how Google bot is viewing a blog and what issues may occur inside the blog.
If you want to pursue your career in digital marketing, join the Digital Marketing Institute in Jaipur.
Let Me Take You Inside The Google Search Console Performance Report Measurement.
First Off, Google Delivers The Results On These Parameters In The Performance Report:
- Total Click On Your Listing In Organic SERP
- Total Impressions Of Listings
- Average CTR For A Website
- Average Position Of Your Keywords In Goggle
- Featured Rich-Results Performance
- Previous Months Of Data (Up To 16)
- The Keywords Which Are Making The Visitors Land On Your Website.
- Your Main Traffic Resources
- From Which Devices You Are Getting Traffic
- From Which Countries Your Visitors Are.
Sounds Good!
What happens if you get answers to all the above questions?
You can exactly get the directions which way the website promotional strategy should go.
Apart From This :
You can compare website performance on daily, weekly, monthly, and yearly.
An ultimate website performance report could be extracted through this tab.
I am taking the example of my old client’s website. He had a travel website, and I was working on that to implement SEO strategies.
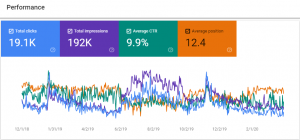
See the below picture of the performance report with a graph.
This Is A 3-Month Report :
This graph is exhibiting the last three months of users’ activities on the website.
Following Metrics are displayed in the Performance report:
Click Data – Aggregate Clicks on the website organic listing.
CTR – Total clicks result in the percentage. Click-through-rate can be calculated by this rule –
Total Impressions/ Total Clicks * 100
Impressions – The total number of times your website is viewed in the Google search results by searchers.
Average Position – Your average position of webpages. It is concluded by the grouping of keywords (Based on total results).
Get Into This :
These filters are let you modify the time duration to investigate results for the different periods set.
Utilize 6 Different Options :
- Most Recent Data
- Last 7 Days
- Last 28 Days
- Last 6 Months
- Last 12 Months
- Last 16 Months
The last one is the custom feature in which you can decide the date and month-based duration and click on the apply button.
You have the privilege to examine sixteen months old data.
Awesome!
Yes, you can understand how your website was performing in Google SERP.
Next in the Same Tab, There is a Compare Feature :
Start Comparing the Data In Google Search Console :
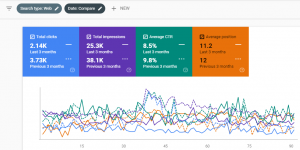
This is another awesome segment to monitor your website performance in terms of clicks and impressions.
Search console lets you compare the click and impressions by the past time.
Options are available right below the tabs.
You can compare country based traffic, devices based on desktop and smartphone traffic by employing different dimensions.
Note – To keep the data store, the export feature can be used to do so.
Learn Through Graph In Google Search Console :
As the first step, you can see a graph containing the different metrics.
It is showing none other than click, impressions, and CTR. You can add more points inside this to show the flow in the graph. Utilize filters to make the Graph more informative and accurate.
Clicks and impressions data surface by default. Also, the time duration is added right below the metrics.
Now the Performance Table Of Google Search Console :
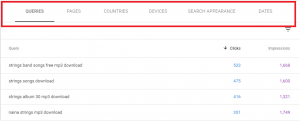
Queries In Google Search Console
It shows the queries that are being searched by searchers. Analyze keywords along with respective CTR and impressions.
Understand the user intent behind the queries. Separate branded and non-branded keywords.
Pages In Google Search Console
You can able to see on which page people are clicking in the SERP to land on the website. Performance report delivers the total and most visited webpages with displaying their permalinks.
Countries In Google Search Console
Do you want to know from which countries people are landing on your website?
See the next filter, where you can extract the countries list. Check visitors from the target location.
Here you cannot see the city name, city-based locations could be pursued in the Google Analytics.
Devices In Google Search Console
Head over to the devices section. Mostly smartphones, tablets, and desktop devices options are available.
Search Appearance In Google Search Console
This Option Works For Rich-Results And Supports The Following Results.
If visitors go through the following results in the SERP and land on your website then you can find the aggregate data in the performance report. Example of Performance Report
- Video Results – Google Displays Videos In The SERP That Could Be Clicked By Viewers.
- Rich-Results – A User Lands On A Site Through The Rich-Results.
- Review-Snippet – Reviews Appear In The SERP.
- Q&A Results – Visitors Read The Question-Answer Extracted By Google.
- AMP Articles Results – Blog Post Hosted Over The AMP Version.
- AMP Story – A Story Is Being Run Over The AMP Version Of The Website Or Blog.
- Events – Events Rich-Results.
- AMP Image Result – An Image Is Running Over The AMP Version.
- Simple AMP Results – A Simple Organic Listing (AMP Version Or M Version)
- Featured Box – So-Called 0rt Ranking.
- Search Results Link – All Links In The SERP Relevant To The Domain Property.
- Site Links Results – Additional Links That Appear Right Below The Listing.
Conclusion –
Google Search Console Performance Report Makes You More Aware Of Your Precise Website Performance In The Google Search Results Page. Example Of Performance Report